rtprof
A profiling tool is used to identify which functions in some program
are consuming the most time in order to identify program areas that
would benefit from optimisation. Such a tool can also be used to
generate a call graph of some program execution. A call graph is a graphic
representation of how the functions in a program call each other, where a graph
node represents a function and directed edges connecting these nodes indicate
one or more calls from one function to another. Usually with profiling tools,
this call graph is in a textual form and consequently difficult to interpret by
humans. The graph is made easier to comprehend by using computer graphics to
represent it visually.
Existing profiling tools analyse pre-generated profiling data off-line, after
the program under measurement has terminated. Often it would be useful to be
able to examine the profile of a program while it is still executing. rtprof
aims to be a tool capable of profiling a running process and
rendering a call graph incorporating the profile interactively.
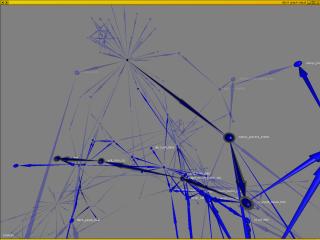
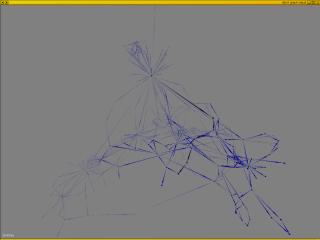
Some screenshots of rtprof in action:


The profile of the program being measured is incorporated into the visualisation
as follows:
- The size of each graph node represents the amount of time spent in that
function. This is done proportionately so that two nodes of the same size have
accumulated the same quantity of run time over the program's execution.
- The colour of each graph node represents the number of times it has been
called. This is also proportionate. A colourmap is used from blue through to
purple through to red. For example a node which is blue has been called few
times in relation to the total number of function calls made whereas a node
which is red has been called many times.
- The colour of each graph edge represents the number of times one function
called another. The colour is used in the same way as with graph nodes.
- The transparency of graph nodes and edges indicates the activity of a
function. A largely transparent graph node represents a function which has not
been called for some time as opposed to a totally opaque graph node which has
been active very recently.
- Both graph nodes and edges are rendered with a dark shell around them if
they are currently active - in other words if they are part of the call stack.
- Each graph node is annotated to the right with the name of the function it
represents.
Sourceforge project pages


